Simplified Data Collection#
This section will guide you through the data collection interface and the data collection process for Simplified projects.
Data collection for Simplified projects follows four basic steps:
Read the project information, survey questions, and possible answers.
Draw and/or select the sample points.
Assign the sample points an answer for each question in the survey.
Save your answers.
You do not need to be logged in to CEO to collect data for Simplified Projects.
Terms and conditions#
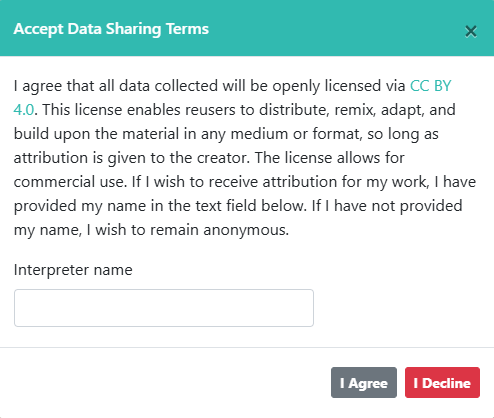
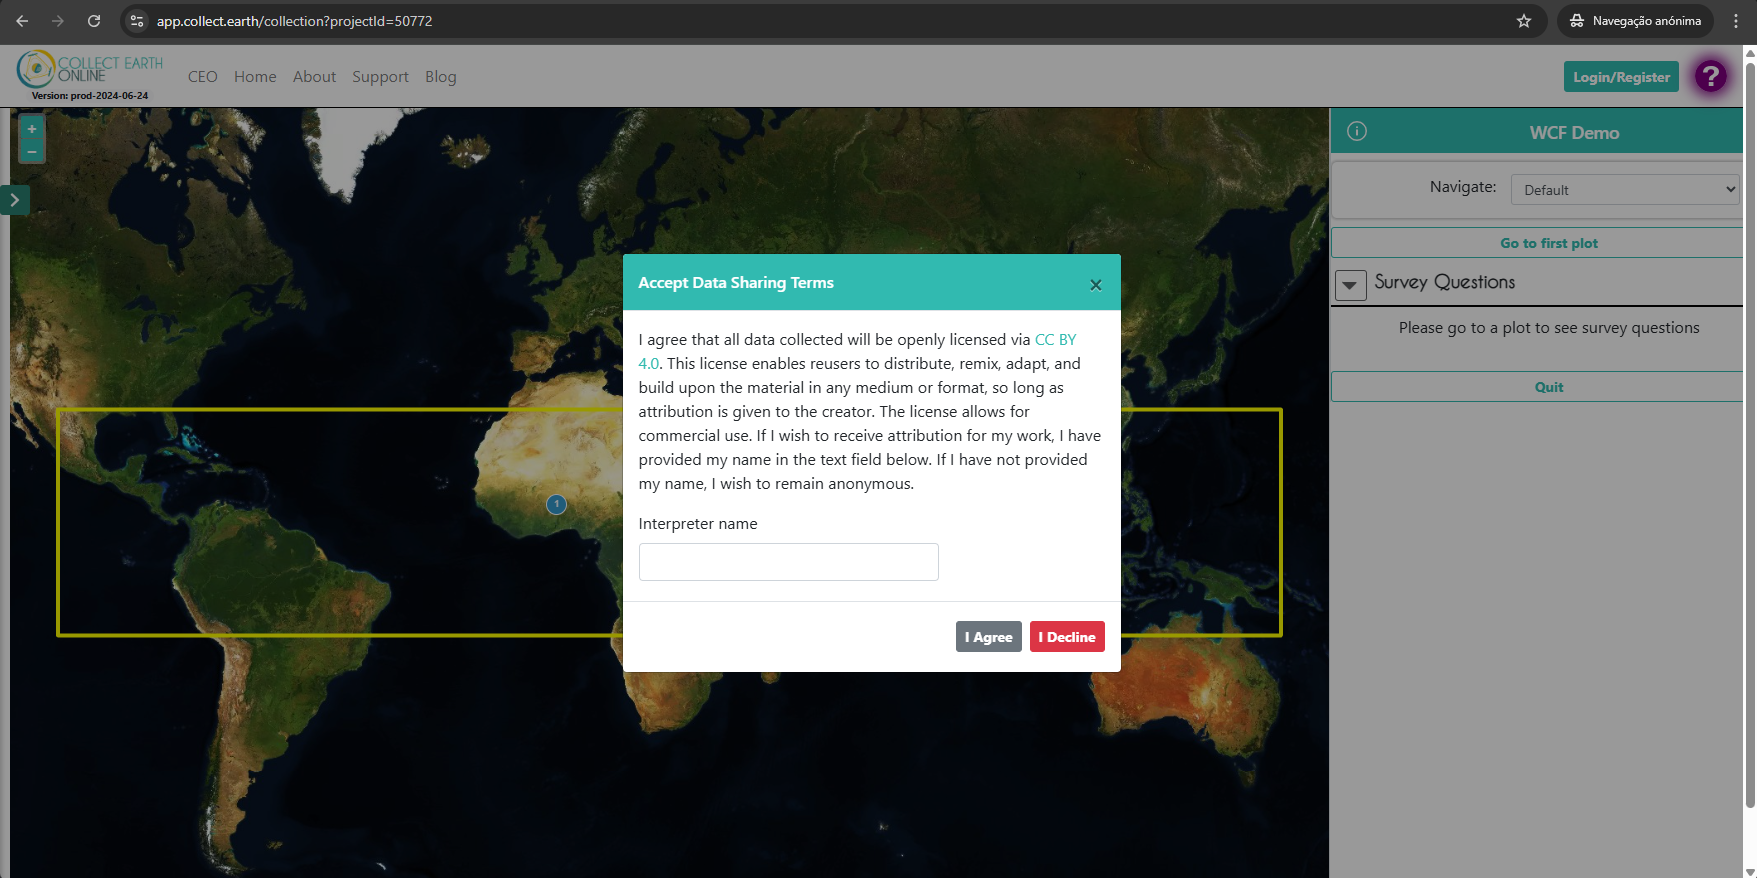
Before you can start collecting data, you must agree to the terms and conditions of the project. You will be prompted to accept or decline the terms and conditions to voluntarily collect data. You can also add your name if you would like to be recognized for your work. The collected data will be licensed through a CC BY 4.0 license.
The analysis screen#
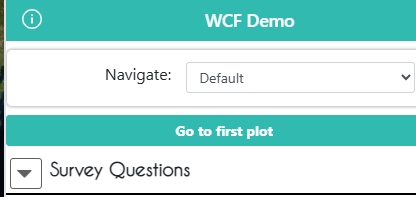
First, make sure you click the [Go to first plot] button.
Now we will familiarize ourselves with the analysis screen.
Tip
You can access help for the analysis screen at any time by clicking on the purple ? in the top right hand corner of the screen. The help function will point out important features of the data collection page.

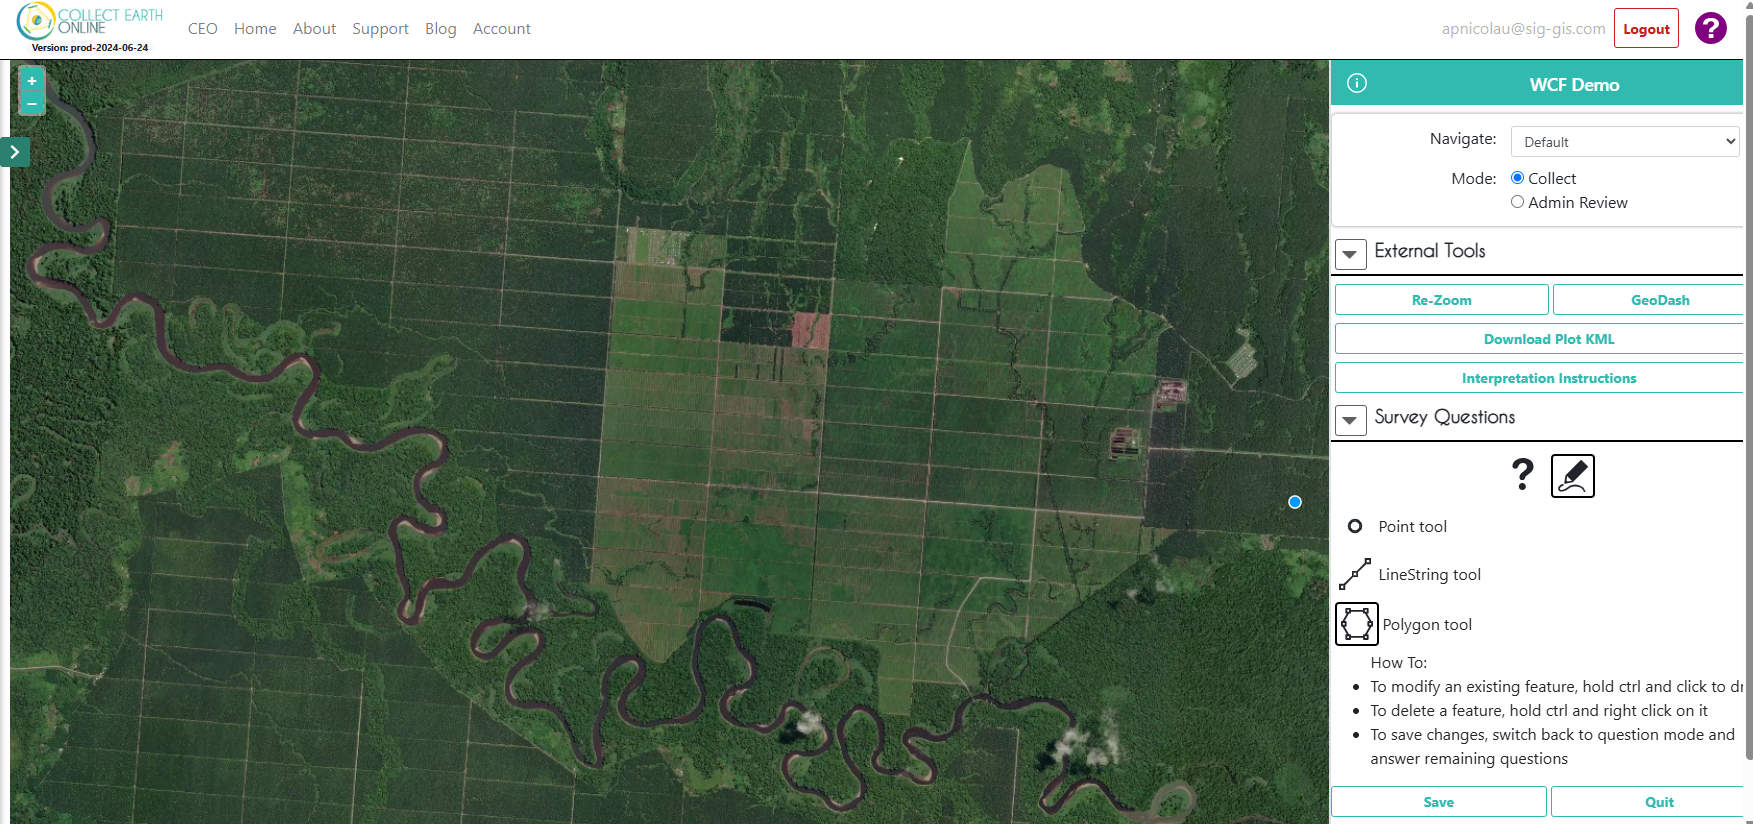
Map Window#
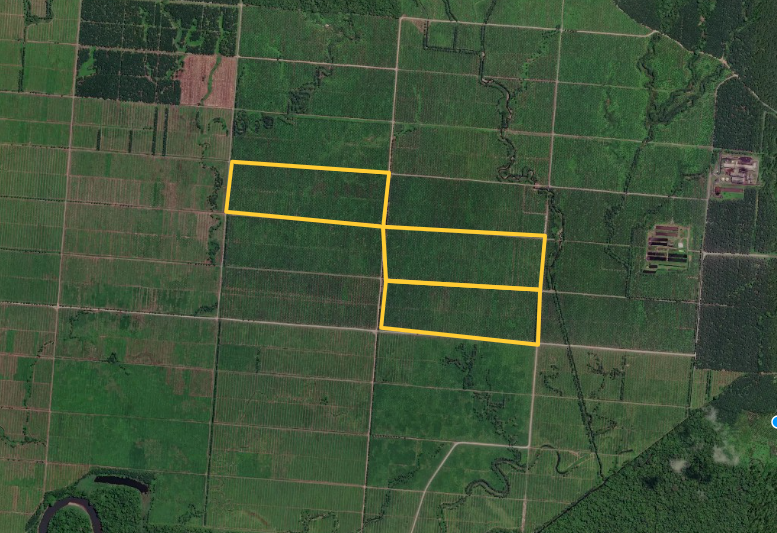
In the center is the map window:
Your Area of Interest will show up as a yellow rectangle in the map window.
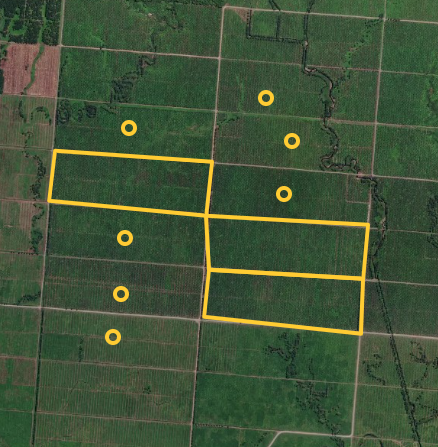
Each Sample Point is identified with a black outline until it is assigned a label.
Tip
You can change the color of sample points that don’t have answers from black to white by selecting the corresponding color radio button next to “Unanswered Color” on the right-hand panel.
You can zoom in and out using the blue + and – buttons in the upper left-hand corner of the map window, or by scrolling your mouse wheel.
Information about the imagery source is shown at the bottom of the screen.
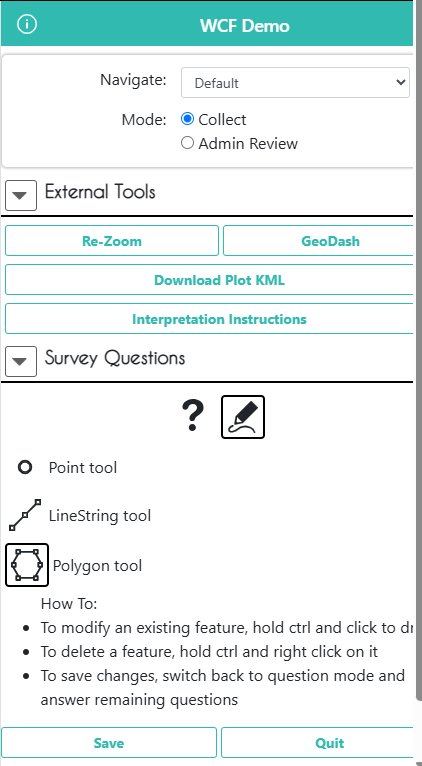
Options and Survey Questions#
On the right-hand side are navigation options, external tool options, and survey questions.
Navigation options:
The navigation options are disabled for Simplified projects.
External Tools options:
Click [Re-Zoom] to return your focus to the entire Area of Interest.
Click [GeoDash] to open the GeoDash pane with additional information about the plot, if it is available for the project (For more detail see Geo-Dash interface).
You can click [Download Plot KML] to download a KML file with the information of any samples you have drawn. Downloading the KML allows you to transfer the plot information to another program, such as Google Earth Desktop. Importantly, the KML functionality allows users to determine the coordinates (latitude and longitude) at which points of interest are located.
-
The [Go to GEE Script] button may or may not be present on your dashboard. If it is present, it will take you to an Earth Engine Apps website displaying additional data about the plot.
This screen will have 6 panels. On the far left, there is a Sentinel 2 composite of the last 12 months. They are colored as infrared color composite (near infrared, mid infrared, red). Reddish brown is forest, agriculture, grass, and shrubs are a lighter shade of orange. Water is purple, and urban areas are shades of blue and green.
In the center are Landsat 8 and Landsat 7 Color Yearly mosaics, with a slider so you can choose between years.
On the right are NDVI graphs of the plot from MODIS, Landsat 7/8, and Sentinel 2. For the Landsat 7/8 and Sentinel graphs, you can click a point on the graphs to load specific images in the left and center panels.
Click [Interpretation Instructions] to open a pop-up window with instructions on how to collect data for the project. These instructions are provided by the administrators leading the project. This information can be useful if you are unsure how to answer the survey questions.
User-drawn samples
Simplified projects rely on user drawn samples. You will need to draw points, lines, or polygons on the map before you can answer the survey questions.
There are two icons under Survey Questions, a question mark and a pencil.
For simplified projects, the [pencil icon] is selected by default. You will see the options that allow you to draw different points, lines, and polygons on the map.

You can switch between the different shapes by clicking on their respective icons. Note that the project administrator may have restricted the types of geometries (point, line, polygon) that you can create.
You can swithch modes by clicking on the [question mark]. Then, the Survey Question interface will work as discussed below.

Survey Questions
This is the area to answer the project’s Survey Questions.
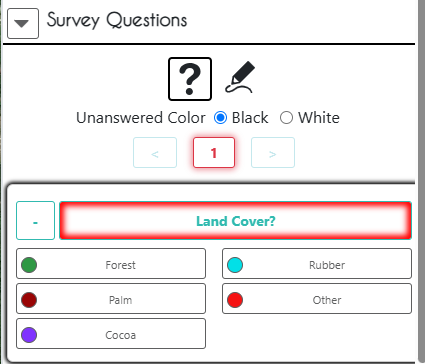
Each project has a different set of numbered survey questions (in the example only “1” question is in the project).
You can navigate between questions using the forward and back arrows or the numbers.
The [Unanswered Color] radio button changes the color of the survey shapes.
The [Save] button will save your survey answers (it only becomes active when all shapes have been interpreted).
[Quit] will return you to CEO’s Home page. If you try to leave the page without saving your answers, you will receive a warning and reminder to save your answers if appropriate.
Imagery Selection Pane
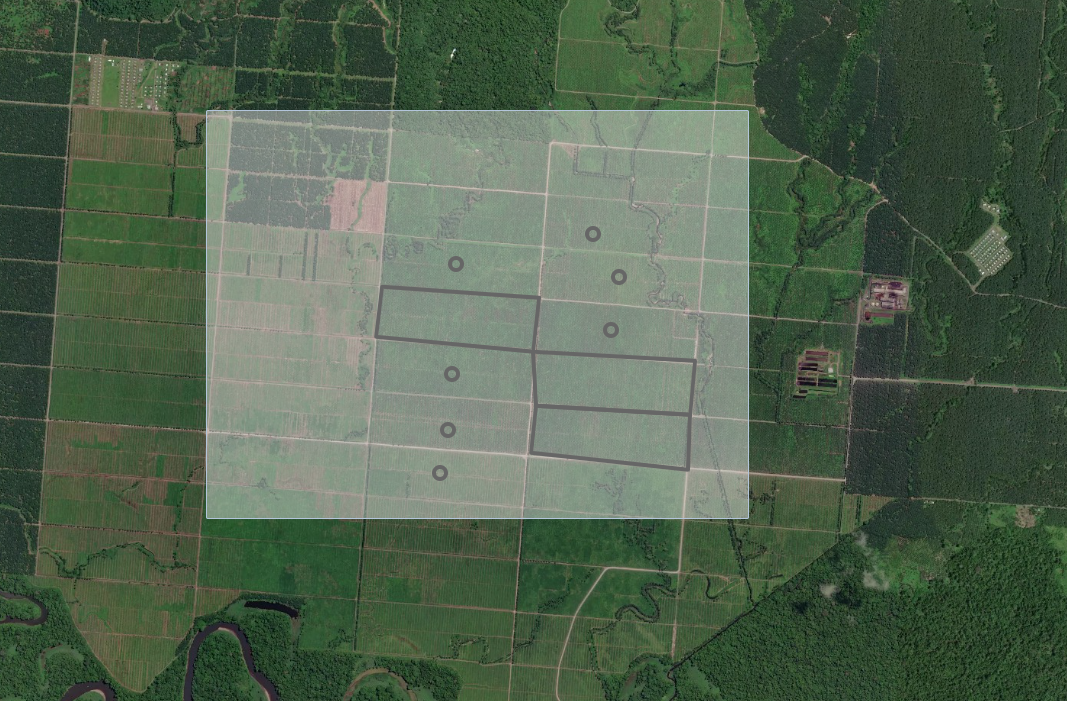
For Simplified projects, the Imagery Selection Pane can be expanded by clicking on the arrow on the left hand side of the screen.
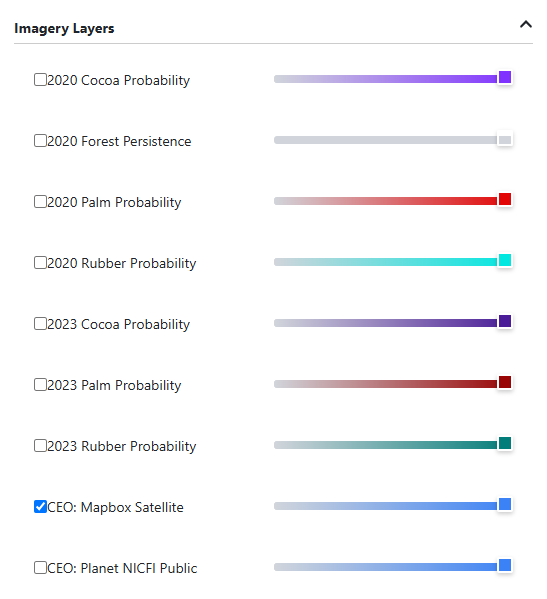
You can turn on different imagery layers by clicking the toggle button next to the imagery name.
You can change the opacity of the imagery by moving the slider.
You can change the order that imagery displays by clicking and dragging the imagery name.
Different images are helpful for comparing different points in time and/or where one imagery source does not have enough detail to answer the Survey Questions. Some imagery options also include the names of towns, villages, etc.
Note
Some imagery servers are slow. Please be patient when switching to sources like Planet Daily, since their servers can take about 30 seconds to respond to queries sent by the CEO platform.
Collect data#
Now it is time to contribute to a project.
If your team has sent you a link to a project, click on the link to take you directly to the project.
You will see a pop-up window with the terms and conditions when you first enter the project if you are not logged in. You must click [I Agree] to proceed. You can add your name if you would like to be recieve attribution for your work. If you are already logged in, you will not see the terms and conditions pop-up.
The collected data will be licensed through a CC BY 4.0 license.
Now click on Go to first plot on the right panel to start the collection.
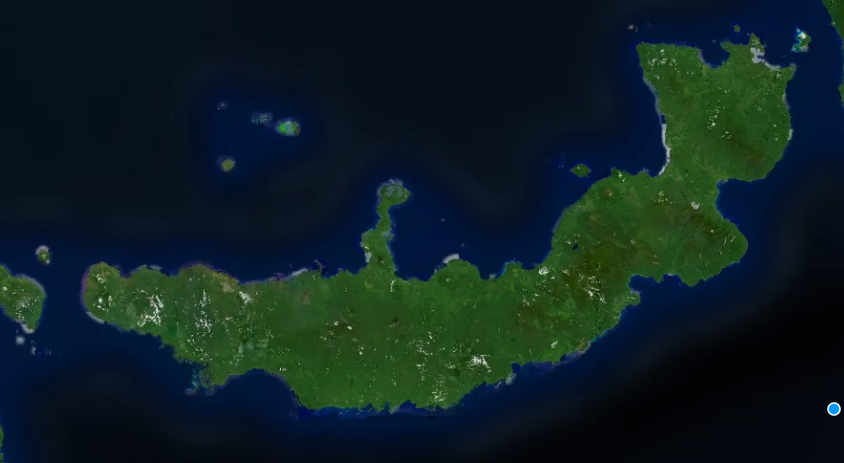
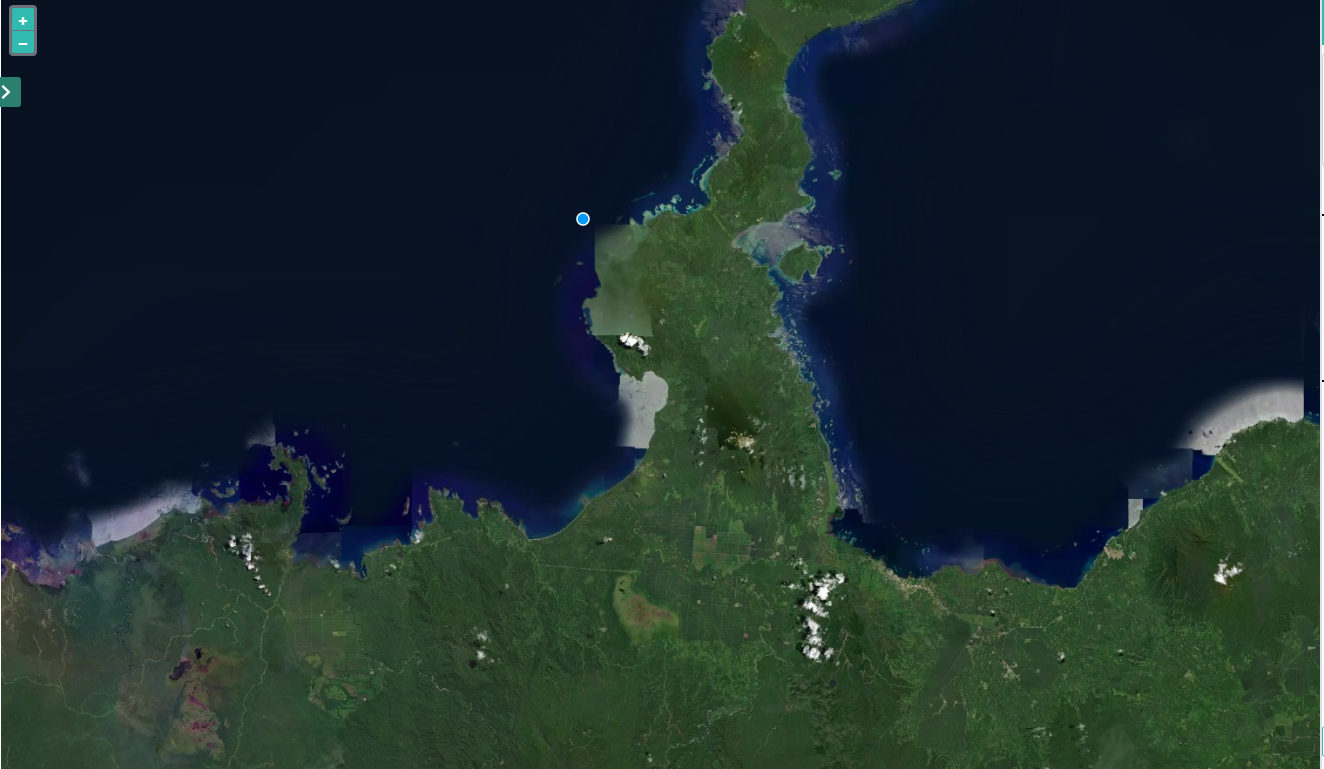
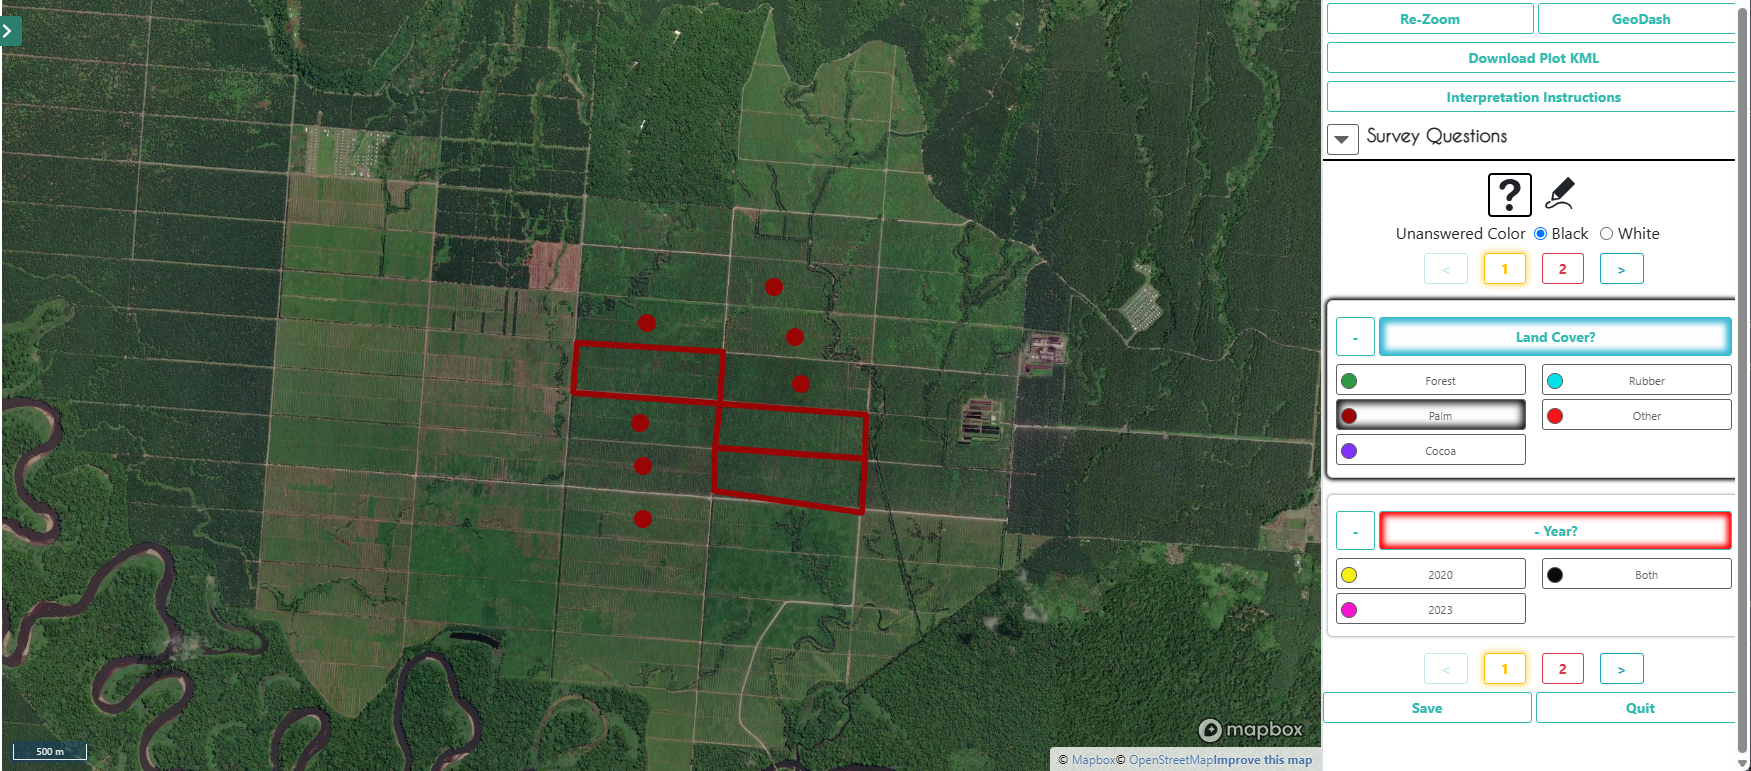
To illustrate how to collect data in a simplified project, we will use the example of a project that asks you to identify the location of different types of land cover, specifically looking at agricultural plantations in Indonesia. First, we zoom in to find some plantation boundaries.
On the right panel, under Survey Questions, select the edit mode to enable the polygon tool. This means that you can start collecting data.
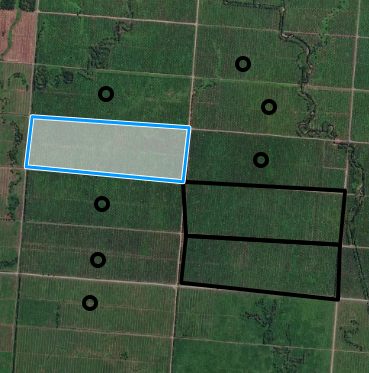
To create the polygon, click to create vertices. To close the polygon, click on the first vertice again.
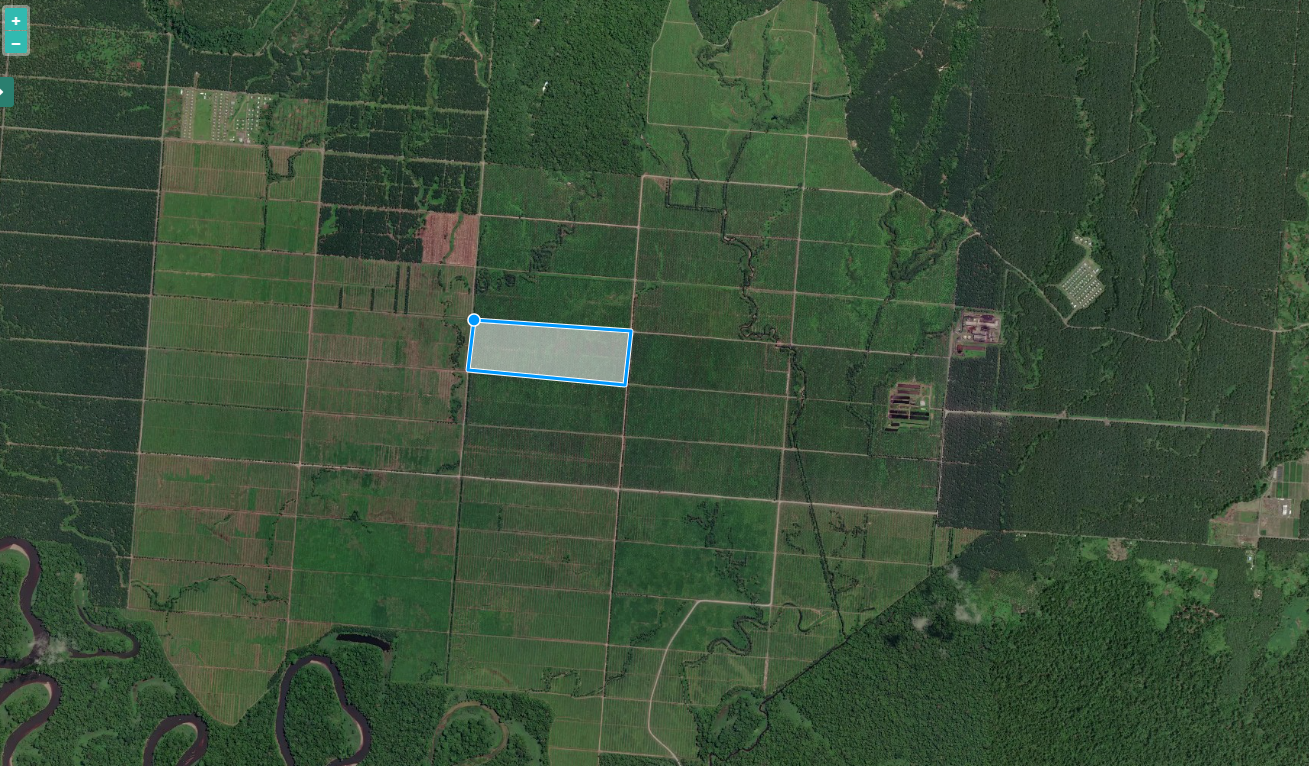
It will turn yellow when you have completed the polygon.
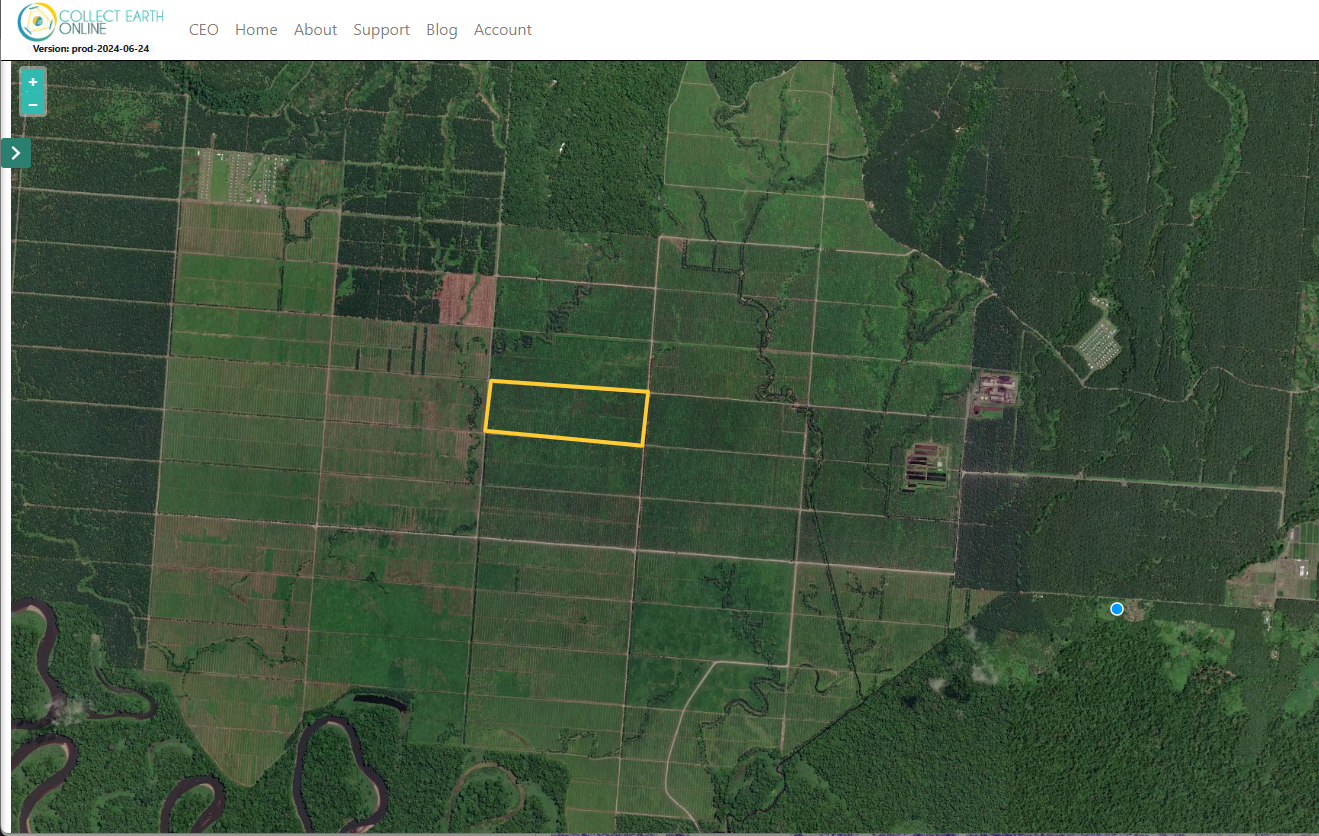
Do this as many times as you want (ideally in all areas that you know of plantations).
Depending on the project settings, you can also place points at the center of the fields. Switch to “Point tool” to collect points.

This is a good way to speed up collection time.
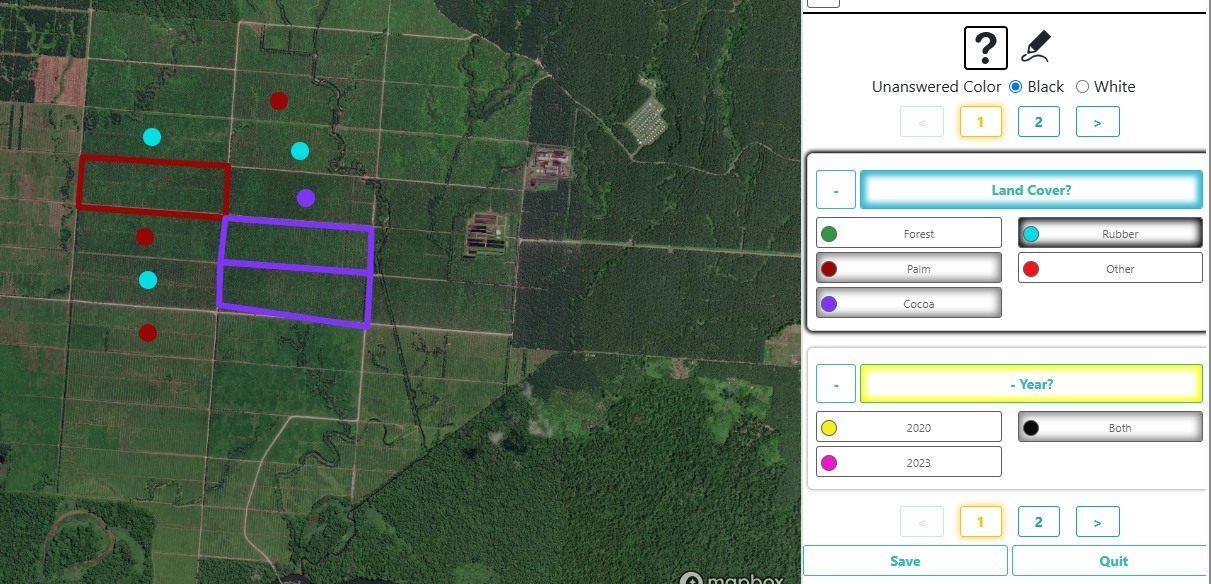
When you are done collecting, switch to the question mark under “Survey Questions”.You will need to answer the question for each shape (e.g. polygon, point) created.

If all the shapes are the same plantation, hold CTRL and select them all at once.
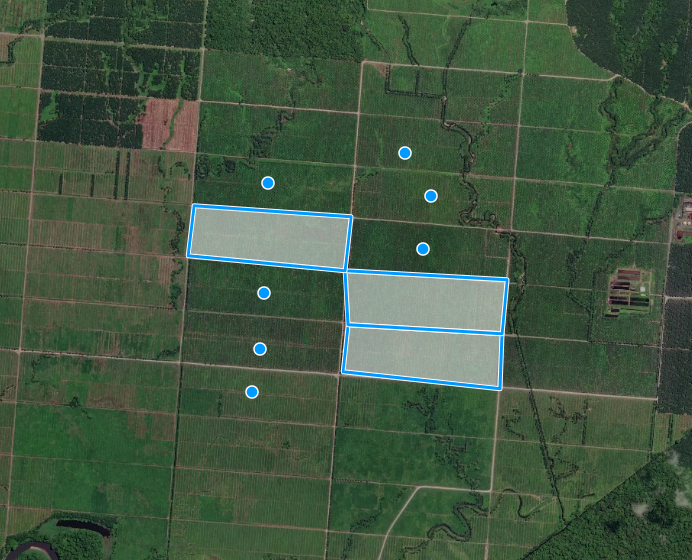
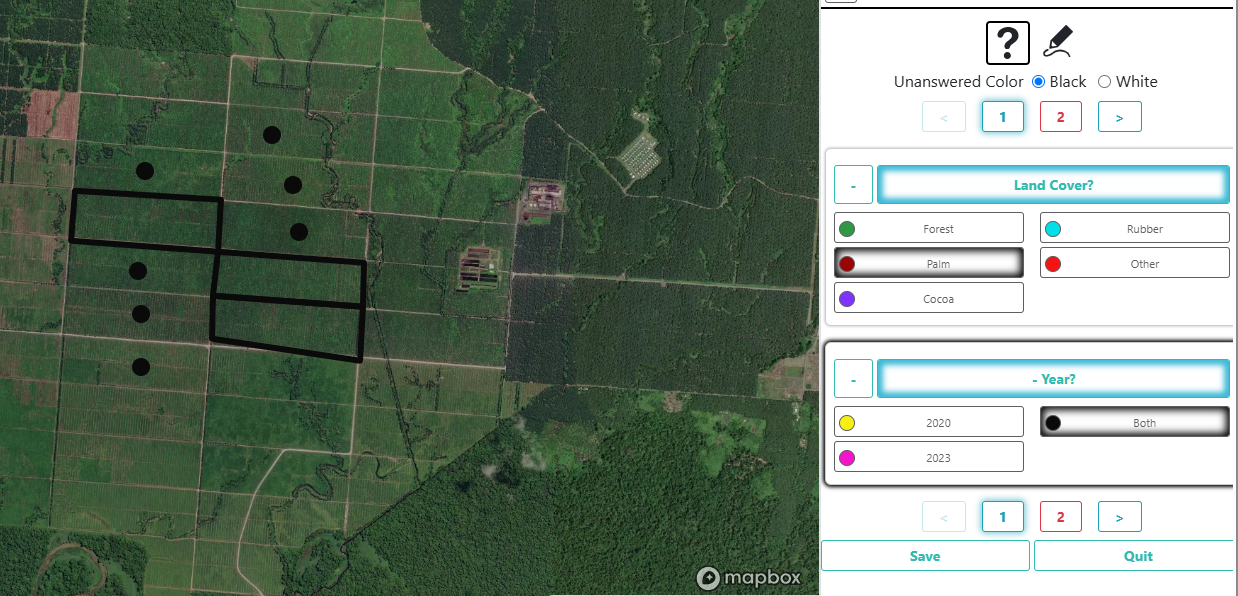
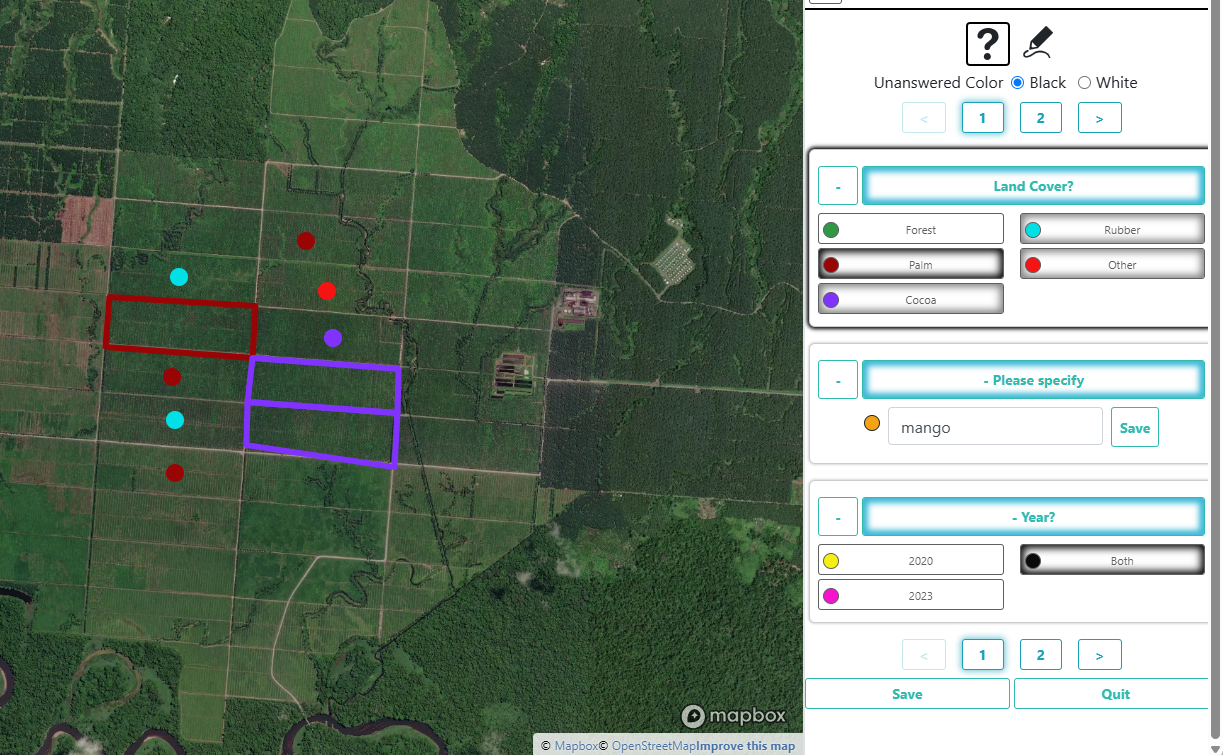
Click on the answer you wish to select. For this example, we are selecting Palm. You will see the data changing color. You will also note another question appearing. This is because the example project has been set up to ask a follow-up question when you select Palm.
E.g. Select “Both” to confirm these plantations exist in both 2020 and 2023.
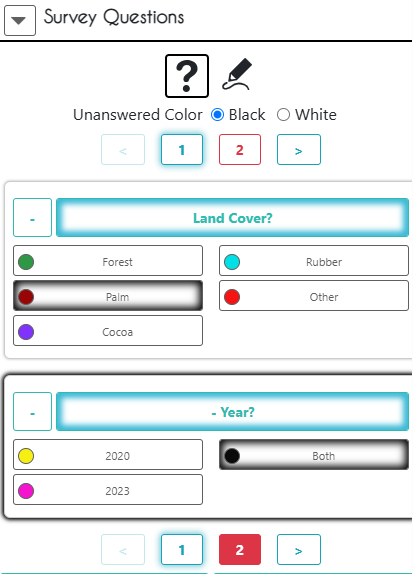
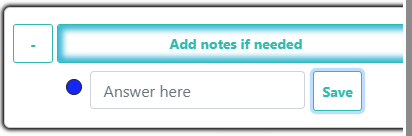
The example project has multiple questions. Here, we click on the number [2] at the bottom of the Survey Questions to advance to the next question.
The second question allows us to add notes about the shapes if desired, e.g. “These palm trees were planted in 2018”, or to leave it blank. Other projects may require notes to be added, but for this example it is optional.
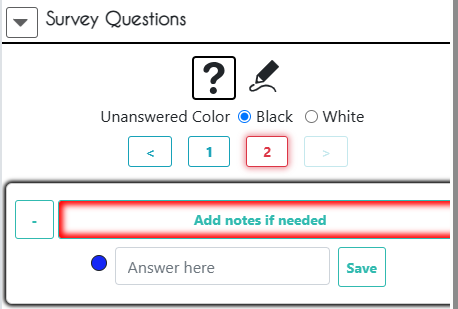
Click [Save] to save the notes (empty or not).
You could also collect data from different plantations. You can select them separately by clicking on them individually to answer the questions, or use CTRL to select multiple shapes.
You will need to repeat the process for the Year question and Notes question.
When you have answered all the questions, the [Save] button will become active. Click it to save your answers.
You can click on the [Save] button at any time to save your answers. If you try to leave the page without saving your answers, you will receive a warning and reminder to save your answers if appropriate.
If you get an error about unanswered questions, make sure they are all answered for all polygons/points. The question boxes will turn green if they have been answered (don’t forget the notes question has to be saved too, even if it is empty).
Using the Imagery Selection Pane#
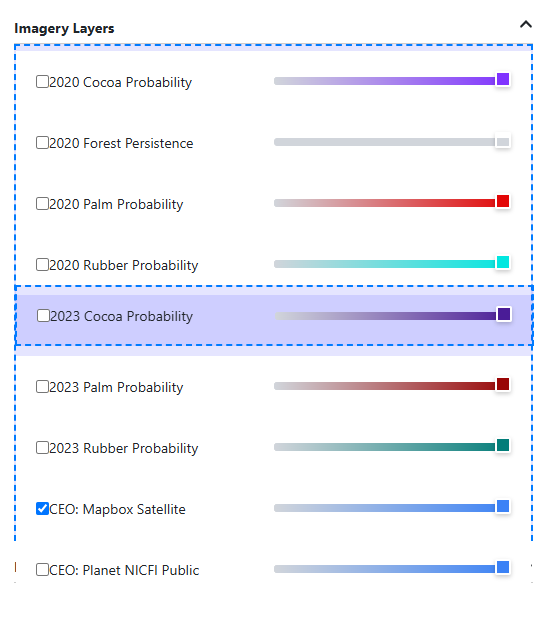
The Imagery Selection Pane can be expanded by clicking on the arrow on the left hand side of the screen. You can use this pane to change the imagery source, opacity, and order.
For our example project, we can use the Imagery Selection Pane to compare model outputs for different types of crops in 2020 and 2023.
Reorder the layers for better visualization later if needed - e.g. group the 2020 and 2023 cocoa layers, 2020 and 2023 rubber layers, etc.
Do this by dragging and dropping the layer.
You can also change the opacity of the layers to see the underlying imagery better.