Creating a Project for Validation#
Creating a project in CEO to validate a spatial model—for example, a land cover map or a forest change map—presents some unique sampling and project design issues. In this section, we provide a very brief overview these issues both for single and for ensemble change maps.
Many resources provide a more in-depth review of this subject. Consider looking at:
CEO’s Theoretical Manual, available here: https://collect.earth/downloads/CEO_Theoretical_Manual.pdf
the FAO’s Map Accuracy Assessment and Area Estimation: A Practical Guide available online here: http://www.fao.org/3/a-i5601e.pdf
Documentation in AREA2, available online here: https://area2.readthedocs.io/en/latest/background.html
A great overview on confusion matrixes here: http://spatial-analyst.net/ILWIS/htm/ilwismen/confusion_matrix.htm
Accuracy assessment#
Accuracy assessments allow producers of spatial models to understand how accurate they are, that is, how well the model fits. This information is important for many reasons, including improving accuracy and determining if the product is suitable for management use.
For single models, such as a single land cover classification map, a confusion matrix is used to calculate the accuracy of spatial models. The purpose of this error analysis is to quantify two key metrics for each land cover class as well as the overall classification:
Given that a pixel is of a (land cover class, etc.), what is the chance that it was correctly classified as that (land cover class, etc.)?
Given that a pixel has been classified as a (land cover class, etc.), what is the chance that it belongs to that (land cover class, etc.)?
There are two pieces of information needed to answer these questions: the ‘true’ land cover class assignment, which is done by a human, and the ‘as classified’ land cover class assignment, which is output by the model. An example of the end goal (the confusion matrix) is shown below for a two class system.
Actual: Forest |
Actual: Not Forest |
|
|---|---|---|
Predicted: Forest |
29 (true positives) |
22 (false positives) |
Predicted Not Forest |
12 (false negatives) |
50 (true negatives) |
For ensemble models, the approach is dependent on the type of ensemble model. For ensemble models where you have combined the results of the different models into a single model (e.g. through averaging), you can use an approach like that used for single models.
Where you have multiple different maps, you may need a more complex approach. For example, if you have two model outputs you may choose to stratify based on the values of both outputs. We will not discuss more complex approaches in depth here.
Validation goals & required sample size#
Precision & accuracy goals for a project help us decide on the sample size and sample design.
Precision is how close your measurements or estimates are to one another. This is sometimes called dispersion. Precision describes random errors & variability.
Accuracy is how close your measurements or estimates are to the true answer. Accuracy describes systematic errors—including observational error. In statistics this is sometimes called bias instead of accuracy. Accuracy is sometimes hard to evaluate as the “true” value might not be known—but with Land Use & Land Cover analysis usually it can be.
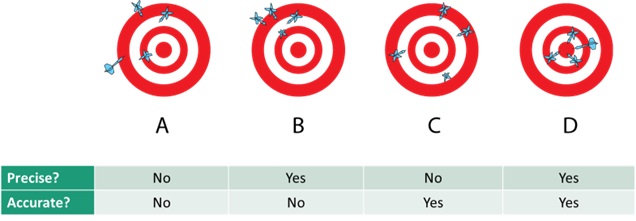
In this example, A is neither precise nor accurate. B is precise, but not accurate. C is accurate, but not precise, and D is both precise and accurate. This is of course where we would like to be ideally.
Accuracy and precision influence the necessary sample size. Detecting small changes in outcome (e.g. 4% decrease in forest cover) with high certainty requires large sample sizes.
When you are determining your sample size, you will want to consider the primary goals of the project, along with the resources available for data collection.
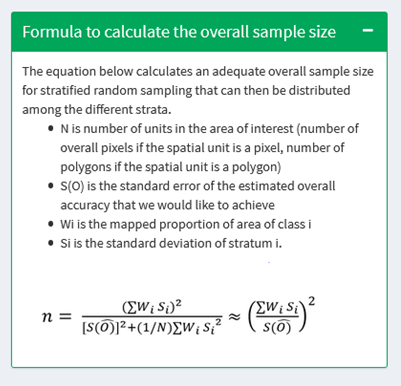
There are many different formulas for determining sample sizes. Which one you want to use is based in part on your sampling method (simple random sample, stratified random sample, etc.). For example, from SEPAL.io:
Area Estimation & Accuracy Assessment (AREA2) also has helper scripts for determining sample size, including assigning area-based weights. Instructions can be found here: https://coded.readthedocs.io/en/latest/sample.html.
If you have access, the following paper also has a good approach specifically tailored to classification: Foody, G. M. Sample size determination for image classification accuracy assessment and comparison. Proc. 8th Int. Symp. Spat. Accuracy Assess. Nat. Resour. Environ. Sci. 30, 154–162 (2008). https://doi.org/10.1080/01431160903130937
Sampling approach#
For validating a single model or an ensemble model that has been averaged/combined, stratified sampling is the preferred method. This is to ensure you can accurately and precisely determine how well your classification performs for each of your predicted groups (land cover classes, forest degradation, etc.). If you use random or gridded sampling, you might not sample enough points in rare classes to be able to tell if they are well estimated.
Strata used for stratification must be exhaustive–they include the entire study area–and they must be exclusive–a sample unit can’t belong to more than one strata.
CEO can create stratified sampling designs if you provide an appropriate shapefile for the AOI. You also have multiple good options to create a stratified sample outside of CEO.
You can use sepal.io to create a stratified sample based on how accurate you think your model is for each stratum and a raster of your model output.
You will need to sign up to use it by visiting sepal.io and clicking on [Sign Up].
From the apps, find the Stratified Area Estimator-Design tool.
From there, follow SEPAL’s directions.
You can also run this on your own machine; see the instructions here: openforis/accuracy-assessment
You can also use QGIS or ArcGIS for creating a stratified sample. Many resources are available online, including:
This blog post for QGIS: https://pvanb.wordpress.com/2012/12/03/stratified-random-sampling-in-qgis/ Note you will need to convert your classification raster to a vector layer.
This description of the Sampling Design Tool in ArcGIS: https://www.arcgis.com/home/item.html?id=28f08ca526ae44e8ac107a2a0d5f50e3
Once you have created a stratified sample, you can create a project in CEO and follow the directions to upload your sampling points into CEO (see Plot Design).
After collecting data on all of your sampling points, you can download the data (see Project Information Interface) and calculate your confusion matrix.
Alternative: Using TimeSync#
TimeSync is an application that allows researchers and managers to characterize and quantify disturbance and landscape change by facilitating plot-level interpretation of Landsat time series stacks of imagery (a plot is commonly one Landsat pixel).
TimeSync can be used to validate map data products, especially where estimating change is a primary objective. Also, TimeSync can facilitate production of independent estimates of change and disturbance rates from remotely sensed imagery.
For more information on TimeSync please see: http://timesync.forestry.oregonstate.edu/. A tutorial on how to use TimeSync is available at: http://timesync.forestry.oregonstate.edu/tutorial.html.