Built-in & Custom Imagery Sources#
You can add Imagery to your Institution in Collect Earth Online (CEO) to use in your Projects. This is often referred to as a basemap or background map. Basemaps provide context for the data you collect, allowing you to see the landscape and land use changes over time.
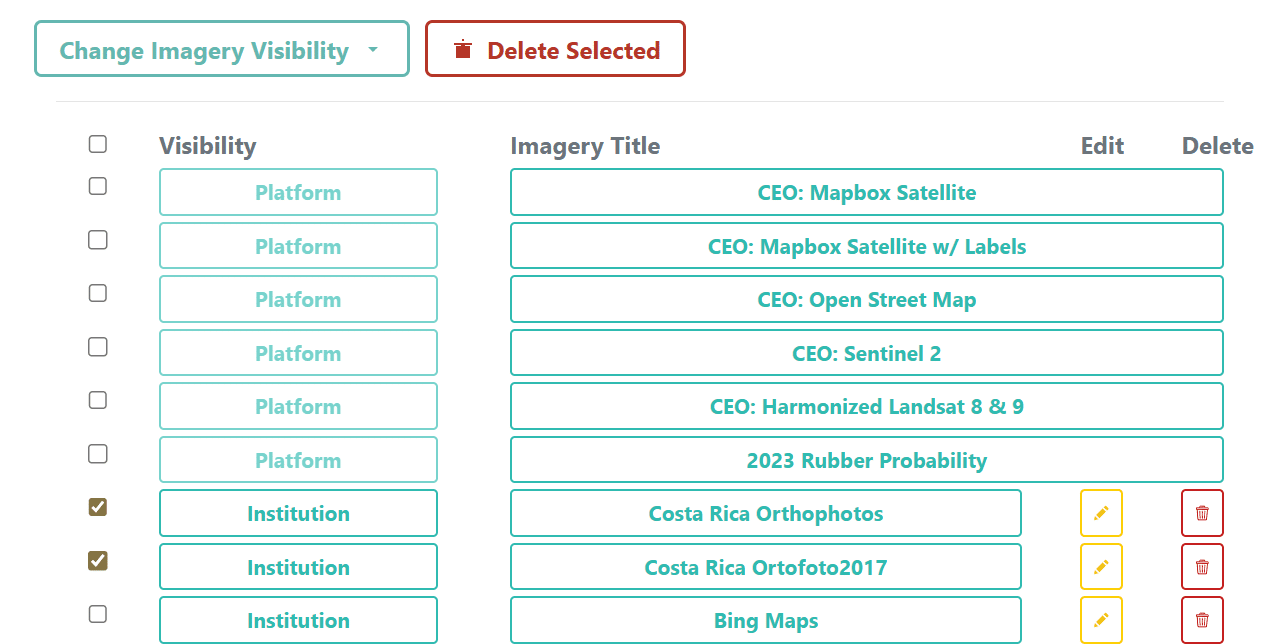
The Imagery tab of your Institution page allows you to add new imagery sources, view existing imagery sources, and manage the visibility of your institution’s imagery.
You can add new imagery sources by clicking on the [Add New Imagery] button. More information on this process is available in the section below.
You can Change the visibility of your institution’s imagery by clicking on the [Change Visibility] button after selecting one or multiple imagery sources. The default is for imagery you add to be Private Institution Imagery and only available to be used by projects from this institution.
You can also delete imagery sources by clicking on the [Delete] button after selecting one or multiple imagery sources. This will permanently delete the imagery source from your Institution and all Projects that use it.
The [Edit] button brings up the form to edit the imagery source. You can change the alt, attribution, and other settings for the imagery source.
Imagery Overview#
There are two main ways to add background, or basemap imagery to your Institution for use in your Projects. First, CEO includes a handful of built-in imagery options, including imagery from MapBox and Sentinel. Second, CEO allows users to connect their own imagery from many different sources, including Google Earth Engine, Bing Maps, XYZ tiles, WMS and more.
Warning
Planet NICFI Public imagery is no longer available in CEO because the NICFI Satellite Data Program ended on April 1, 2025. We will update the documentation once the new NICFI data program begins. For further assistance, please visit: https://www.planet.com/tropical-forest-observatory/.
Warning
Maxar has eliminated multiple data products that were previously available on CEO, including: DigitalGlobeRecentIMagery; DigitalGlobeRecentImagery+Streets; DigitalGlobeWMSImagery; and EarthWatch.
In addition, SecureWatch is now MGP Pro. You can connect to MGP Pro through their WMS server and XYZ services.
Imagery Permission Levels#
There are three permission levels available in CEO: one built-in and two institution-based options that can be customized for your needs. These settings help institutions manage imagery more effectively, enabling open sharing when appropriate while maintaining security for sensitive datasets.
Platform Imagery: This is CEO’s built-in imagery, curated and maintained by the CEO development team. It includes commonly used datasets such as Mapbox Satellite, OpenStreetMap, Landsat, and Sentinel-2.
Platform imagery is always available to all users, whether or not they are logged in or part of an institution.
Private Institution Imagery: CEO’s traditional custom imagery, Private Institution Imagery is visible only to logged-in members of your institution, regardless of the project’s visibility setting.
Even if a project is open to all CEO users, only your institution’s members will see this imagery.
This option is useful for sensitive or licensed imagery that requires controlled access.
Public Institution Imagery: As CEO’s new imagery permissions option, Public Institution Imagery is available to anyone collecting data on your projects in CEO, while remaining managed within your institution.
If your project is public, this imagery will be visible to all users.
This setting works well for community mapping or citizen science projects that benefit from open access.
Changing Imagery Permissions#
To change the visibility of your imagery:
Go to the Imagery tab on your institution page.
Select the imagery layers you want to update by checking the boxes next to them.
Click [Change Imagery Visibility], then choose your preferred permission level.
Click [Change] to apply your new settings.
Your imagery permissions will update immediately.
Built-in base imagery sources#
There are a handful of built-in imagery options in CEO. Each of these options has different strengths and limitations.
Mapbox#
MapBox is an open-source mapping platform for custom designed maps. The satellite imagery uses different sources based on the zoom level and geographic availability. According to Mapbox’s documentation:
Zoom levels 0–8 use de-clouded data from NASA MODIS satellites.
Zoom levels 9–12 use Maxar satellite imagery along with NASA/USGS Landsat 5 & 7 imagery in limited locations.
Zoom levels 13+ use a combination of open and proprietary sources, including Maxar’s Vivid product for most of the world, Nearmap aerial imagery over US cities, and open aerial imagery from Denmark, France, Germany and other regions.
More information can be found in Mapbox’s documentation.
MapBox Satellite and Mapbox Satellite w/Labels are thus composite satellite imagery, where each map tile may be stitched together from imagery acquired on multiple dates. There is not necessarily a single date for an imagery tile. This is the same as, for example, Google Maps and Bing Aerial Imagery.
CEO uses Mapbox’s satellite layer as well as one with place and landmark labels.
Adding custom basemap imagery#
The built-in imagery is not sufficient as basemaps for some projects, including projects comparing land uses between two time periods, or projects that need imagery from specific dates or months. CEO allows institutions to add new imagery sources through their Institution page. This section discusses the different imagery types that can be added.
The instructions below assume you are starting on your Institution page and are logged in as an Administrator for your Institution.
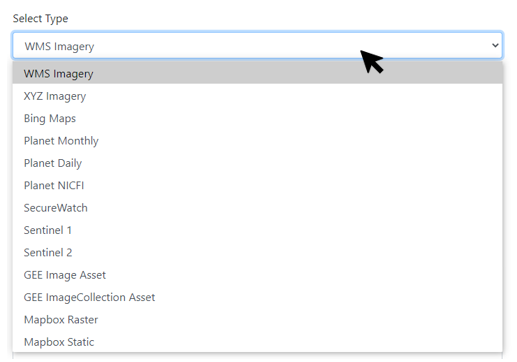
Under the Imagery panel on the Institution page, click [Add New Imagery]. Under Select Type you will see multiple different options. Some, including WMS Imagery and XYZ Imagery, are protocols that can be applied broadly, while other options connect to specific data sources that you generally need to subscribe to.
For Bing Maps, Planet Monthly, Planet Daily, and the MapBox products you will first need to locate your no-authentication API key. You will be asked to provide this key in the CEO imagery setup panel.
We will now talk about how to add imagery for each of these options.
WMS Imagery#
This option can be used to access data your Institution hosts or data services that use WMS or WTMS. Imagery must be accessible using WMS or WTMS. Images stored locally on a user’s computer cannot be added to a CEO project, although they can be accessed if you upload them to a WMS or WTMS (as a basemap), or as a Google Earth Engine Asset (for Geo-Dash and/or basemap).
The information needed to set up the WMS server will differ based on the specific imagery you are.
-
The first step of preparing to connect to your WMS with CEO is checking that your WMS is compatible with CEO.
CEO requests data in EPSG:3857. Your WMS server is responsible for reprojecting the imagery it hosts into this requested projection.
CEO requires the servers to use the https protocol.
-
Second, to connect your web map service (WMS) to CEO, you need to gather three pieces of information: the base URL for your WMS, the layer name that you want, and any parameters your WMS requires to serve imagery.
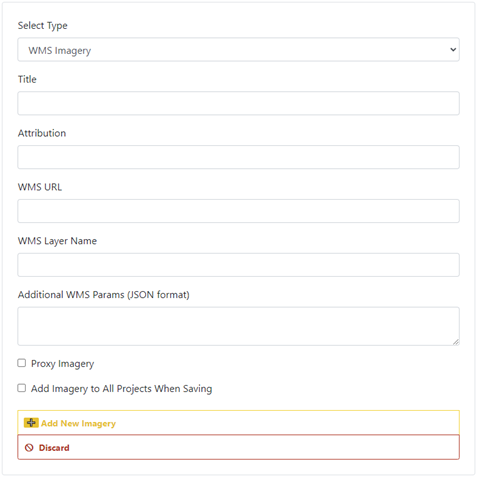
Title: This will be the displayed name of the imagery.
Attribution: This is the displayed attribution for your imagery. It will appear at the top of the map while users perform data collection tasks.
URL: This should be the URL of your WMS/WTMS. It should be preceeded by https://
Layer Name: This is the layer name from your server that you want to display.
-
Params (as JSON object): If there are any parameters for the layer you want to specify, put them here as a JSON object. Documentation for the WMS getMapService is available online here. These work only if they are parsed by the target WMS. Here are some examples:
{"TILED": true}

{"VERSION": "1.1.1", "CONNECTID":"63f634af-fc31-4d81-9505-b62b4701f8a9", "FEATUREPROFILE":"Accuracy_Profile", "COVERAGE_CQL_FILTER":"(acquisition_date>'2012-01-01')AND(acquisition_date<'2012-12-31')"}
Note
Quotes MUST BE ASCII/neutral/vertical quotation marks. Using “” smart/typographic/curved quotation marks will cause errors. Use only Unicode U+0022 and U+0027.
If you need to proxy your imagery for your WMS, please check Proxy Imagery. You may need this option if you need to obfuscate a key for your WMS or WTMS.
If you want to add this imagery source to all of your institution’s projects, check the box next to Add Imagery to All Projects When Saving.
When all fields are filled out, click on [Add New Imagery].
If you are having trouble, we have posted an extensive how-to and troubleshooting guide on the CEO blog. You can view that guide here: https://collect.earth/blog/add-wms-to-ceo/.
XYZ Tiles#
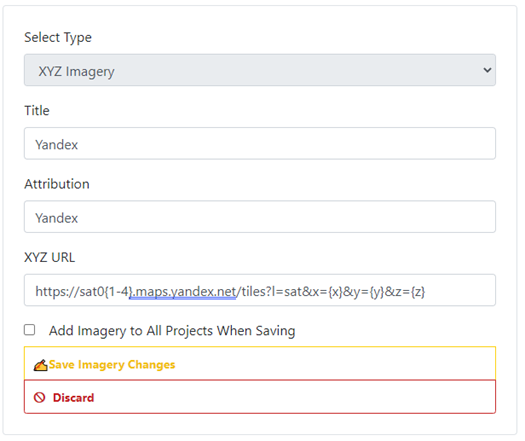
XYZ Tiles is a flexible way of adding imagery. Services you can now add includes any of the adaptations of Open Street Maps, Yandex, and any other service using XYZ.
Title: This will be the displayed name of the imagery.
Attribution for the XYZ Imagery. This will be shown to your users in the data collection pane.
-
Add the XYZ URL.
By default, XYZ uses the widely-used Google grid, where (x,y) (0,0) are in the top left.
In general, it should have the format: <URL>?x={x}&y={y}&z={z} . For example, https://mt1.google.com/vt/lyrs=y&x={x}&y={y}&z={z}
You can also use grids where (x,y) (0,0) are in the bottom left. To do so, you will need to use the following format: <URL>?x={x}&y={-y}&z={z}
Note
Sometimes you will need to edit a provided URL to make it compatible with CEO. For example, the Open Street Map WIKI provides the following URL for the German version of Open Street Maps: https://a.tile.openstreetmap.de/${z}/${x}/${y}.png. As provided this will not work. To make it work, you will need to delete the “a.” subdomain and the “$” characters.
The edited URL does work in CEO: https://tile.openstreetmap.de/{z}/{x}/{y}.png
If you want to add this imagery source to all your institution’s projects, check the box next to Add Imagery to All Projects When Saving.
When all fields are filled out, click on [Add New Imagery].
Bing Maps#
This imagery option allows you to add Bing Maps with your own API key. The Bing tile system uses the Mercator projection and has 23 levels of zoom (though not all levels are available in all locations). Commonly, the resolution at max zoom is about 0.3 m per pixel. For more information, see https://docs.microsoft.com/en-us/bingmaps/articles/bing-maps-tile-system.
Note
The imagery provided by Bing Maps is composite satellite imagery. This means that each map tile is stitched together from imagery acquired on multiple dates. There is not a single date for an imagery tile. Some map tiles contain imagery collected over a multi-day window while other tiles contain imagery collected over a multi-year window. As there is not a single date for an imagery tile, CEO cannot provide the exact date of the imagery used. If you’re interested in learning more, the Bing Maps API can be found here: https://docs.microsoft.com/en-us/bingmaps/rest-services/imagery/imagery-metadata.
Title: This will be the displayed name of the imagery.
Imagery Id: Only Aerial and AerialWithLabels are currently implemented. Note that the AerialWithLabels imagery uses the legacy static tile service, which is deprecated, and current data will not be refreshed. It therefore may have older imagery than the Bing Aerial dataset.
Access Token: Your BingMaps key. For more information or to obtain your own key, see https://docs.microsoft.com/en-us/bingmaps/getting-started/bing-maps-dev-center-help/getting-a-bing-maps-key.
If you want to add this imagery source to all of your institution’s projects, check the box next to Add Imagery to All Projects When Saving.
When all fields are filled out, click on [Add New Imagery].
Directions for requesting a Bing maps key:
To use Bing Maps imagery for your projects, you can create your own FREE Bing maps key to connect your institution’s projects to your Bing Maps account. The full directions for creating a key are here: https://docs.microsoft.com/en-us/bingmaps/getting-started/bing-maps-dev-center-help/getting-a-bing-maps-key.
Visit https://www.bingmapsportal.com/ to request a Bing key or copy your existing key.
Sign in. You will need a Bing maps account or Microsoft account (https://docs.microsoft.com/en-us/bingmaps/getting-started/bing-maps-dev-center-help/creating-a-bing-maps-account)
Once you have logged in, click on My account, then click on My Keys.
If you already have a key, click Show key or Copy key.
If you do not have a key, click on Click here to create a new key.
Fill out the information. Application URL is optional, but if you do use it, use https://app.collect.earth as your Application URL
You will create a Basic key. If you need more imagery, you will need to talk to Microsoft and request an Enterprise key (https://www.microsoft.com/en-us/maps/create-a-bing-maps-key#enterprise).
Planet Monthly#
Planet offers multiple data products (product specification here: https://support.planet.com/hc/en-us/articles/360022233473-Planet-Imagery-Product-Specifications). This option pulls from the Planet Monthly mosaic product, which allows you to display imagery from a specific month. User help is available here: https://developers.planet.com/docs/apps/explorer/.
Title: This will be the displayed name of the imagery.
Default Year: The default year that will be displayed when the map loads.
Default Month: The default month that will be displayed when the map loads. Use integer format 1-12.
Access Token: Your Planet access token. This can be accessed through your My Account page on the Planet website.
If you want to add this imagery source to all of your institution’s projects, check the box next to Add Imagery to All Projects When Saving.
When all fields are filled out, click on [Add New Imagery].
Tip
Default Year & Default Month will let you put in any integer, positive or negative. The up and down arrow keys start at 0. Please type year in the YYYY format and month as an integer between 1-12.
PlanetDaily#
PlanetDaily is another imagery product available from Planet. It allows users to detect land use and land cover change in near real time. This data source allows you to select a start and end date, with up to daily imagery resolution. Your study area might not have full coverage every day.
Title: This will be the displayed name of the imagery.
Access Token: Your PlanetDaily API key. This can be accessed through your My Account page on the Planet website.
Start Date: Starting date for the imagery you are interested in; you can input the date using numeric keys or with the calendar widget on the right side.
End Date: Ending date for the imagery you are interested in.
If you want to add this imagery source to all of your institution’s projects, check the box next to Add Imagery to All Projects When Saving.
When all fields are filled out, click on [Add New Imagery].
Sentinel 1 Imagery#
Sentinel 1 information is only available from April 2014 to present (Sentinel 1A launch). Sentinel data is available in CEO through GEE. If multiple images are available for the region and dates selected, the median reducer is used to produce a single image.
Title: This will be the displayed name of the imagery.
Default Year: The default year that will be displayed when the map loads.
Default Month: The default month that will be displayed when the map loads. Use integer format 1-12.
Band Combination: Preset combinations of bands for most uses. VH and VV are single polarization, VH/VV and HH/HV are dual polarization. More info https://sentinel.esa.int/web/sentinel/user-guides/sentinel-1-sar/acquisition-modes.
Min: Minimum value for bands that will get mapped to 0 for visualization. This can be one value for all bands, or a value for each of the three bands separated by commas. Acceptable values for each band’s minimum are the same as for Sentinel imagery available through GEE generally; see https://developers.google.com/earth-engine/datasets/catalog/sentinel. Min can be as low as -50, but 0 is frequently used.
Max: Maximum value for bands that will get mapped to 255 for visualization. This can be one value for all bands, or a value for each of the three bands separated by commas. Acceptable values for each band’s maximum are the same as for Sentinel imagery available through GEE generally. See link above. Max can be as high as 1, but .3 is frequently used.
If you want to add this imagery source to all of your institution’s projects, check the box next to Add Imagery to All Projects When Saving.
When all fields are filled out, click on [Add New Imagery].
Sentinel 2 Imagery#
Sentinel 2 imagery is available from June 2015-present. Sentinel 2 imagery is displayed in CEO from GEE. If multiple images are available for the region and dates selected, the median reducer is used to produce a single image.
Title: This will be the displayed name of the imagery.
Default Year: The default year that will be displayed when the map loads.
Default Month: The default month that will be displayed when the map loads. Use integer format 1-12.
-
Band Combination: Select one of the options available, including True Color, False Color Infrared, False Color Urban, Agriculture, Healthy Vegetation, and Short Wave Infrared.
True Color: The True color band combination uses the red (B4), green (B3), and blue (B2) channels. Its purpose is to display imagery the same way our eyes see the world. Just like how we see, healthy vegetation is green, urban features often appear white and grey and water is a shade of dark blue depending on how clean it is.
False Color: The False-color infrared band combination is meant to emphasize healthy and unhealthy vegetation. By using the near-infrared (B8) band, it’s especially good at reflecting chlorophyll. It is most commonly used to assess plant density and health, as plants reflect near-infrared and green light while absorbing red. Since they reflect more near-infrared than green, plant-covered land appears deep red. Denser plant growth is darker red. Cities and exposed ground are gray or tan, and water appears blue or black.
False Color Urban: The false color urban band combination uses SWIR (B12), near-infrared (B8), and blue (B2). This composite is used to visualize urbanized areas more clearly. Vegetation is visible in shades of green, while urbanized areas are represented by white, grey, or purple. Soils, sand, and minerals are shown in a variety of colors.
Agriculture: The agriculture band combination uses SWIR-1 (B11), near-infrared (B8), and blue (B2). It’s mostly used to monitor the health of crops because of how it uses short-wave and near-infrared. Both these bands are particularly good at highlighting dense vegetation that appears as dark green.
Healthy Vegetation: Because near-infrared (which vegetation strongly reflects) and red light (which vegetation absorbs), the vegetation index is good for quantifying the amount of vegetation. The formula for the normalized difference vegetation index is (B8-B4)/(B8+B4). While high values suggest dense canopy, low or negative values indicate urban and water features.
Short-wave Infrared: The short-wave infrared band combination uses SWIR (B12), NIR (B8A), and red (B4). This can help to estimate how much water is present in plants and soil, as water reflects SWIR wavelengths. Shortwave-infrared bands are also useful for distinguishing between cloud types (water clouds versus ice clouds), snow and ice, all of which appear white in visible light.
Min: Minimum value for bands that will get mapped to 0 for visualization. This can be one value for all bands, or a value for each of the three bands separated by commas. Acceptable values for each band’s minimum are the same as for Sentinel imagery available through GEE generally; see https://developers.google.com/earth-engine/datasets/catalog/sentinel For example, 0 could be used.
Max: Maximum value for bands that will get mapped to 255 for visualization. This can be one value for all bands, or a value for each of the three bands separated by commas. Acceptable values for each band’s maximum are the same as for Sentinel imagery available through GEE generally. See link above. For example, values of 2800-4000 are frequently used.
Cloud Score: Allowable cloud cover. Values can be 0-100.
If you want to add this imagery source to all of your institution’s projects, check the box next to Add Imagery to All Projects When Saving.
When all fields are filled out, click on [Add New Imagery].
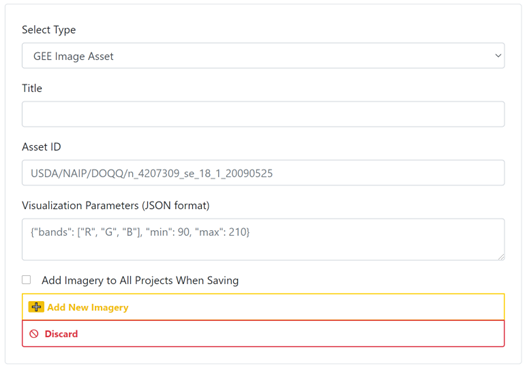
GEE Image Asset#
Google Earth Engine (GEE) Assets include user’s uploaded assets along with assets provided by other users and GEE. Information on Assets can be found here: https://developers.google.com/earth-engine/guides/asset_manager. More detail on uploading your own assets is below. Note that Image Asset refers to a single image (e.g. a GeoTIFF layer) while ImageCollection Asset refers to a stack of images (e.g. GeoTiff layers of the same location over different dates).
Title: This will be the displayed name of the imagery.
Asset ID: The Asset ID for your image asset. Will have a format similar to: USDA/NAIP/DOQQ/n_4207309_se_18_1_20090525
Visualization Parameters (JSON format): Any visualization parameters for your layer. For example, {“bands”:[“R”,”G”,”B”],”min”:90,”max”:210}
If you want to add this imagery source to all of your institution’s projects, check the box next to Add Imagery to All Projects When Saving.
When all fields are filled out, click on [Add New Imagery].
We have created an extensive how-to and troubleshooting guide for adding GEE Image Assets and Image Collection Assets to CEO. It is available in CEO’s blog here: https://collect.earth/blog/connecting-gee-raster-data/. Additionally, we have directions for uploading your own image assets to GEE in the following section.
GEE ImageCollection Asset#
Google Earth Engine (GEE) Assets include user’s uploaded assets along with assets provided by other users and GEE. Information on Assets can be found here: https://developers.google.com/earth-engine/guides/asset_manager. More detail on uploading your own assets is below. Note that Image Asset refers to a single image (e.g. a GeoTIFF layer) while ImageCollection Asset refers to a stack of images (e.g. GeoTiff layers of the same location over different dates).
Title: This will be the displayed name of the imagery.
Asset ID: The Asset ID for your image asset. Will have a format similar to: LANDSAT/LC08/C01/T1_SR.
Start Date: The default start date of imagery to display.
End Date: The default end date of imagery to display.
Visualization Parameters (JSON format): Any visualization parameters for your layer. For example, {“bands”:[“B4”,”B3”,”B2”],”min”:0,”max”:2000}
If you want to add this imagery source to all of your institution’s projects, check the box next to Add Imagery to All Projects When Saving.
When all fields are filled out, click on [Add New Imagery].
Note
To display the GEEImageCollection, CEO uses the ‘mean’ reducer in Earth Engine. This takes the mean of any images in the image collection during the time period specified.
We have created an extensive how-to and troubleshooting guide for adding GEE Image Assets and Image Collection Assets to CEO. It is available in CEO’s blog here: https://collect.earth/blog/connecting-gee-raster-data/.
Uploading GeoTIFF images to GEE:
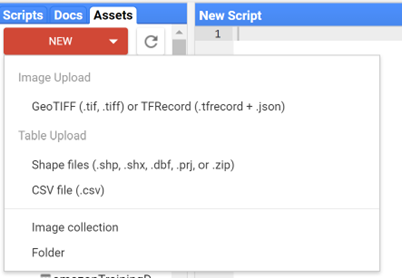
Navigate to Assets
-
Click New, then under Image Upload click GeoTIFF.
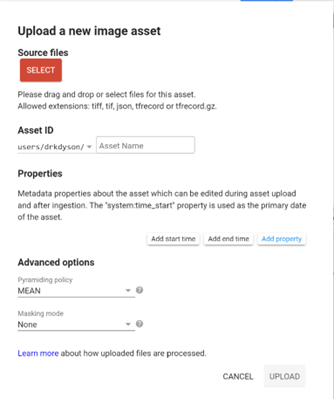
A new window will pop up. Click Select and navigate to the GeoTIFF asset.
Alter the Asset ID name if you would like.
Check the default settings, e.g. if your data has a start/end time then add those.
-
Click Upload.
Wait for your asset to upload. When it does, click on the asset name and a new window will pop up.
Next to ImageID there are two interlocking squares.
-
Click on this to copy your ImageID to the clipboard (you’ll need this to connect to CEO).
You can also click on the “Bands” tab to get more information about your image. This is very useful for specifying your visualization parameters in CEO.
Can also add gamma etc. information, see https://developers.google.com/earth-engine/guides/image_visualization.
MapBox Raster#
MapBox Raster serves raster tiles including Mapbox Satellite. For more information see: https://docs.mapbox.com/help/glossary/raster-tiles-api/.
Title: This will be the displayed name of the imagery.
Layer Name is the desired layer name from MapBox.
Access Token will be your no-auth key from MapBox. For more information, see https://docs.mapbox.com/help/glossary/raster-tiles-api/.
If you want to add this imagery source to all of your institution’s projects, check the box next to Add Imagery to All Projects When Saving.
When all fields are filled out, click on [Add New Imagery].
MapBox Static#
Mapbox Static serves raster tiles generated from a Mapbox GL-based style. This API has additional parameters that can be used to refine the results of a request. More information see: https://docs.mapbox.com/help/glossary/static-tiles-api/.
Title: This will be the displayed name of the imagery.
User Name will be your MapBox user name.
Map Style ID will be the id from MapBox.
Access Token will be your MapBox no-auth key. For more information see https://docs.mapbox.com/help/glossary/static-tiles-api/.
If you want to add this imagery source to all of your institution’s projects, check the box next to Add Imagery to All Projects When Saving.
When all fields are filled out, click on [Add New Imagery].
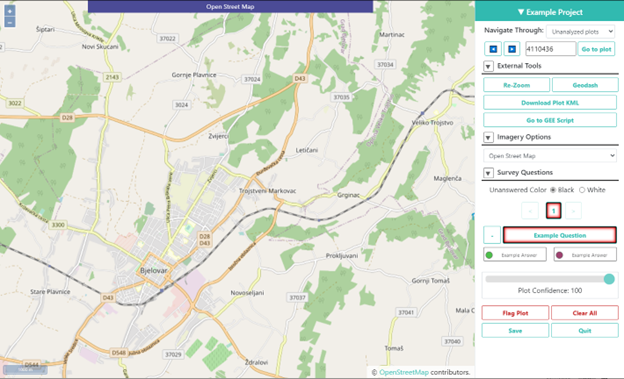
Open Street Maps#
Open Street Maps is an open source mapping product. This provides Open Street Map’s Standard Tile Layer. This product is useful for orienting users, since it has street and place names.
Title: This will be the displayed name of the imagery.
If you want to add this imagery source to all of your institution’s projects, check the box next to Add Imagery to All Projects When Saving.
When all fields are filled out, click on [Add New Imagery].
Adding imagery from multiple time periods#
Adding multiple imagery options with different default time periods can make data collection easier for projects that compare two or more time periods to detect land use and land cover change. WMS/WMTS that you can use to create basemaps from different time points include GeoServer, Planet Monthly, Planet Daily, Bing Maps, Mapbox Raster, and Mapbox Static.
WMS Imagery#
For WMS imagery, how to add different years of imagery depends on your server.
If your different years are stored as different layers, alter the Layer Name field when you add the second layer. Make sure your alt/attribution/etc. fields are accurate for the new layer.
If your server uses filtering to display imagery from different years you will need to alter the parameters field (again, making sure the information in your other fields is correct).
Once you have decided the best approach for your server, repeat the steps in WMS Imagery above for each time period you would like to add.
Note
Some years may not contain any imagery, due to the sparseness of the data within the database. If no imagery for the selected time range appears, you will need to change your parameters field, possibly to change the feature profile or date ranges.
Planet Monthly and Planet Daily#
For all Planet products, you simply need to change the time period fields to add layers with different default time periods. Users will be able to change the time period displayed during data collection; however, this is the default that will be shown first.
Tip
Be sure to change the alt field to reflect the correct default Year, Month, and Day for each new layer that you add.
Sentinel 1 & 2#
Users will be able to change the default Year and Month during data collection. However, additional layers with different default years and months can be added based on user preference.
Tip
Be sure to change the Title field to reflect the correct default Year, Month, and Day for each new layer that you add.
GEE Image Asset#
Different Image Assets that cover different periods of time can be added using the Imagery interface. However, if you have multiple images of the same area over different periods of time, consider using CEO’s GEE’s ImageCollection functionality rather than multiple Image assets.
GEE ImageCollection Asset#
Users will be able to change the default Year and Month during data collection. However, additional layers with different default years and months can be added based on user preference.
Tip
Be sure to change the Title field to reflect the correct default Year, Month, and Day for each new layer that you add.
Editing and deleting imagery#
After you have added imagery you may need to change the default dates of the Visualization Parameters.
Navigate to your Institution page.
-
Next to the imagery you would like to edit, there is an editing hand button.

When you click on the editing hand button, it will take you back to the imagery creation form.
Edit the values as needed, using the information in this section as a guide.
Check the Add Imagery to All Projects When Saving box if you would like to add your imagery to all of the institution’s projects.
When you are done, click Save Imagery Changes.
-
You can delete imagery by clicking the trash can icon next to the imagery name.

Tip
There is currently no way to ‘preview’ what imagery will be visible in your new layer in the ‘Add Imagery’ workflow. There are two ways to work around this.
First, if your data source has a data viewing portal, you can use this to explore the imagery and determine what is available for the time periods you are interested in.
Second, you can add the imagery layer, then open an existing project from your institution. The imagery will be available in the dropdown menu (if you are switching between a project Data Collection window and an Institution window, you may need to refresh the project window to get the new layer to appear). You can then check if the imagery is displaying correctly and go back to the Institution page to edit the imagery based on what you see.
Notes on imagery#
For imagery options with dates, the dates you input are the default Dates that the imagery will be restricted to on the collection page. However, the user will be able to change these when exploring the map as there are start & end date widgets on the collection page sidebar.
The Planet products will not return imagery if the map is zoomed out too much. This results in a white map canvas being displayed at the project overview level usually. Simply click the “Go to first plot” button on the Collection page to zoom in to the plot level, and then the imagery should appear.
Estimating imagery costs#
Before setting up a project in CEO, it is important to estimate how much imagery will be used for budgetary and resource allocation. Here is a quick guide to help.
When is imagery used?#
Imagery data is used whenever there is a map on the page. This means that on CEO, all these pages can use data:
Home
Data Collection
Create Project
Review Project
Project Dashboard
GeoDash (specific options or modules)
On these pages, when the map first loads, imagery data is used. Every time a user zooms or pans the map window, imagery is used. The largest amount of use will probably be with Data Collection.
Estimating imagery use for a project#
Each organization that provides imagery sets their own rules for how many tiles you can download per year given the kind of account that you have with them. Therefore, it is important to estimate this before setting up a project.
Additionally, services may “count” imagery against your quota differently. You will also need to know this.
To figure out how much imagery you are likely to use for a single project, count the number of plots. Then determine how many users will classify each plot. Next, try to factor in how often people will zoom or pan their maps for context when answering the survey questions for a plot. Multiply these numbers together.
Next, decide if you are using the Geo-Dash and ask yourself how many map widgets you will display on your Geo-Dash page. Multiply that number by the number of plots to get the amount of Geo-Dash imagery you will need. Keep in mind that Geo-Dash imagery counts against our annual limit for user memory/processing in GEE, whereas the usual global layers on CEO (Bing Maps, SecureWatch, Planet) have separate annual tile-based limits. For GEE, we recommend clipping and pre-processing the imagery to image assets or imageCollection assets for the collection area. This eliminates processing on-the-fly for each user that is collecting, as Geo-Dash can just grab the pre-processed image asset.
Finally, add a few extra tile downloads for loading the maps while creating and reviewing the project.
Once you have a sense of how many map images you will need for your project, you will then need to look up the tile counting policy for the imagery service that you are using. For example, some of them count 15 tiles as 1 unit of usage. Others use different counting rules.
Tip
To reduce imagery use, consider setting your default background imagery to a cheaper source and only switching to more expensive paid imagery when you are at the correct zoom level.
Synthetic Aperture Radar (SAR) data in CEO for forest degradation#
Observations of backscatter variations over time in satellite SAR data can be attributed to structure and moisture. For forests, these can be linked to changes in the moisture conditions of the trees and soil as well as changes in forest structure. These are extremely useful for e.g. detecting forest degradation.
Color display of SAR data for detecting forest degradation is possible in CEO using Sentinel 1 data, WMS data, and GEE Image Assets and ImageCollection assets.
For information on detecting forest degradation through our Geo-Dash widget functionality, please see Geo-Dash Implementation .
For more information on SAR, please see:
Kellndorfer, Josef. “Using SAR Data for Mapping Deforestation and Forest Degradation.” SAR Handbook: Comprehensive Methodologies for Forest Monitoring and Biomass Estimation. Eds. Flores, A., Herndon, K., Thapa, R., Cherrington, E. NASA. 2019. DOI: .10.25966/68c9-gw82; available online at: https://gis1.servirglobal.net/TrainingMaterials/SAR/Ch3-Content.pdf
The SAR Handbook: Comprehensive Methodologies for Forest Monitoring and Biomass Estimation, available for download at: https://www.servirglobal.net/Global/Articles/Article/2674/sar-handbook-comprehensive-methodologies-for-forest-monitoring-and-biomass-estimation
This one page guide from SERVIR & SilvaCarbon: https://servirglobal.net/Portals/0/Documents/Articles/2019_SAR_Handbook/SAR_VegIndices_1page_new.pdf